Medovia Medical
Medovia Medical
Medovia Medical
In the ever-evolving field of healthcare, understanding how to read the data displayed on a multi-parameter patient monitor is crucial. According to a report by the World Health Organization, heart disease alone accounts for nearly 32% of global deaths. Accurate monitoring can save lives and improve patient outcomes. Multi-parameter monitors provide real-time insights into vital signs like heart rate, blood pressure, and oxygen saturation.
However, effectively interpreting this data requires specialized knowledge. A study published in the Journal of Clinical Monitoring and Computing highlights that many clinicians feel unprepared to analyze this information accurately. This gap in expertise can lead to critical misjudgments, impacting patient care.
Moreover, the fast-paced environment of healthcare often hampers thorough data assessment. Even experienced professionals can struggle under time constraints. Therefore, enhancing skills in reading multi-parameter monitors is essential for improving patient safety and quality of care.
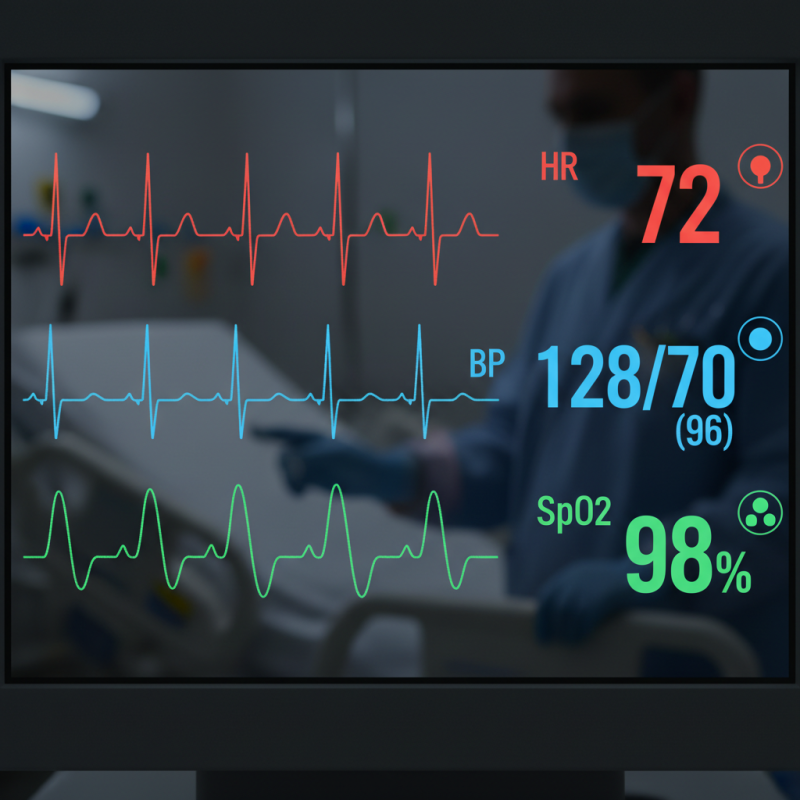
Multi-parameter patient monitors play a crucial role in healthcare. They gather real-time data from various physiological signals. These monitors track vital signs like heart rate, blood pressure, and oxygen saturation. Each parameter provides important insights into a patient’s condition. Understanding these functionalities helps healthcare professionals make informed decisions quickly.
The data is usually displayed on screens in real-time. This immediate feedback is vital in emergency situations. However, managing this data can be overwhelming. Clinicians may face challenges in interpreting multiple parameters simultaneously. It requires a balance of technical skill and clinical judgment. One small change in a parameter might indicate a significant issue.
Despite advancements, some monitors still lack user-friendly interfaces. This can lead to misinterpretations or delays in patient care. Continuous learning and adaptation are necessary for healthcare providers. Training and experience remain essential in navigating complex data. The goal is to enhance patient outcomes, yet it demands ongoing effort and critical reflection.
| Parameter | Normal Range | Measurement Method | Notes |
|---|---|---|---|
| Heart Rate | 60 - 100 bpm | ECG Sensor | Monitors physiological status |
| Blood Pressure | 120/80 mmHg | Cuff/Non-invasive | Indicates cardiovascular health |
| Oxygen Saturation | 95% - 100% | Pulse Oximeter | Reflects lung function |
| Temperature | 36.1°C - 37.2°C | Thermometer | Indicates body temperature regulation |
| Respiratory Rate | 12 - 20 breaths/min | Capnometer | Monitors breathing efficiency |
: It improves healthcare efficiency and enhances patient monitoring in real-time.
Data from heart rate, blood pressure, and oxygen levels can be included.
Compatibility issues and ensuring data accuracy complicate the integration process.
Delivering concise, relevant data helps avoid overwhelming healthcare professionals.
Clinicians need skills to accurately interpret integrated data and improve decision-making.
Dashboards simplify data, allowing quick assessment of patient conditions.
Misinterpretation can occur, leading to incorrect decisions in healthcare practices.
Regular training sessions and adaptive learning methods are essential for development.
Cluttered screens can confuse users, so clear design is crucial.
Regular assessments help identify gaps and areas needing improvement.
Multi-parameter patient monitors are crucial tools in clinical settings, providing a comprehensive overview of a patient's health status by collecting various key data types such as vital signs, oxygen saturation, and cardiac rhythms. Understanding how to read the data displayed on a multi-parameter patient monitor is essential for healthcare professionals to make informed decisions.
To optimize data extraction from these monitoring systems, several techniques can be employed, such as leveraging integrated software solutions and utilizing automatic alerts to enhance the response to patient needs. Furthermore, integrating monitor data with electronic health records (EHR) streamlines patient data management, facilitating better analysis and visualization of trends over time. Adhering to best practices in these areas not only improves the efficiency of patient care but also ensures the accuracy of the information being utilized for clinical decision-making.